
Smarter tests, sharper decisions
Design the test. Run it offline. Trust the report.
DrillTMS replaces paper logs and spreadsheets with one system for designing drill-tool field tests, capturing results on a tablet that works at mine sites with no signal, and building the report straight from the data you captured — not reassembled from spreadsheets afterwards.
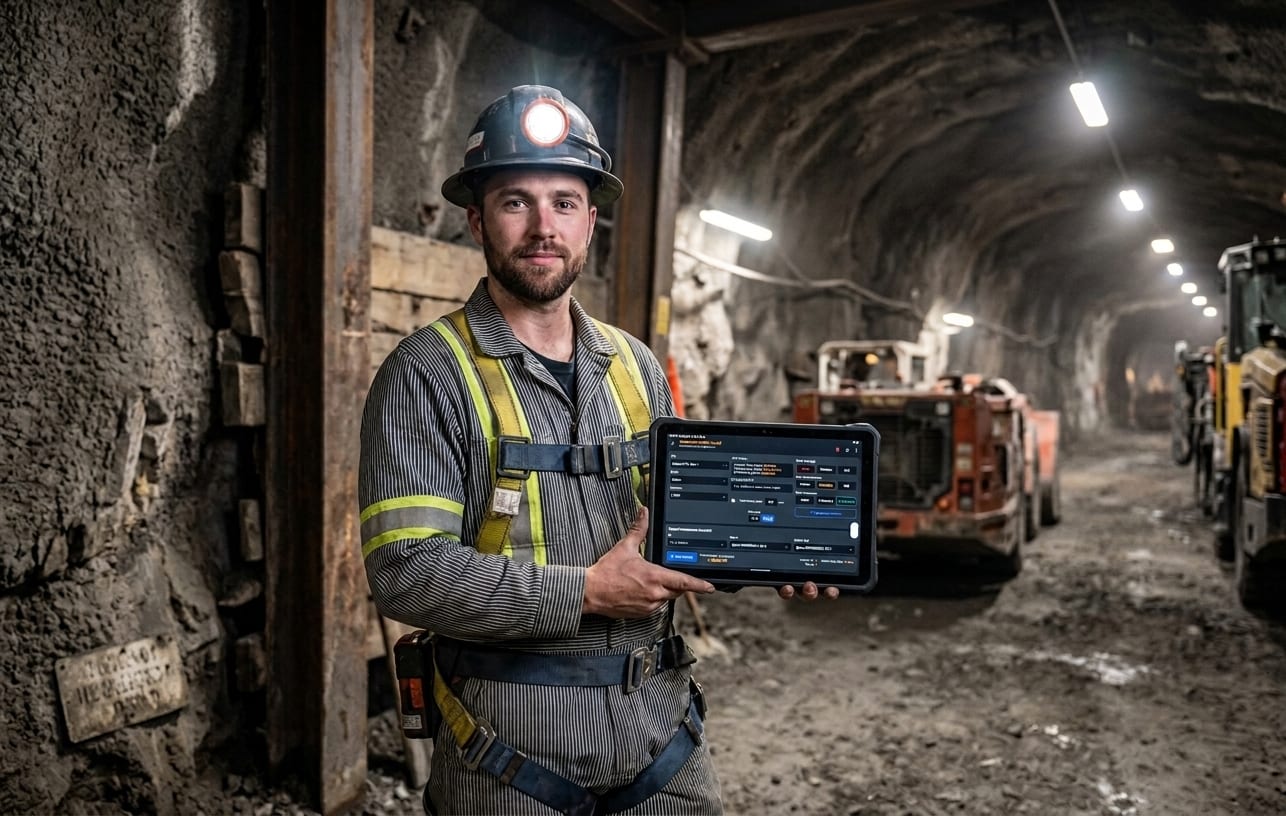
The mission
Transform the rock drilling industry
By turning reliable field-test data, gathered at scale, into shared knowledge and AI models built for drilling.
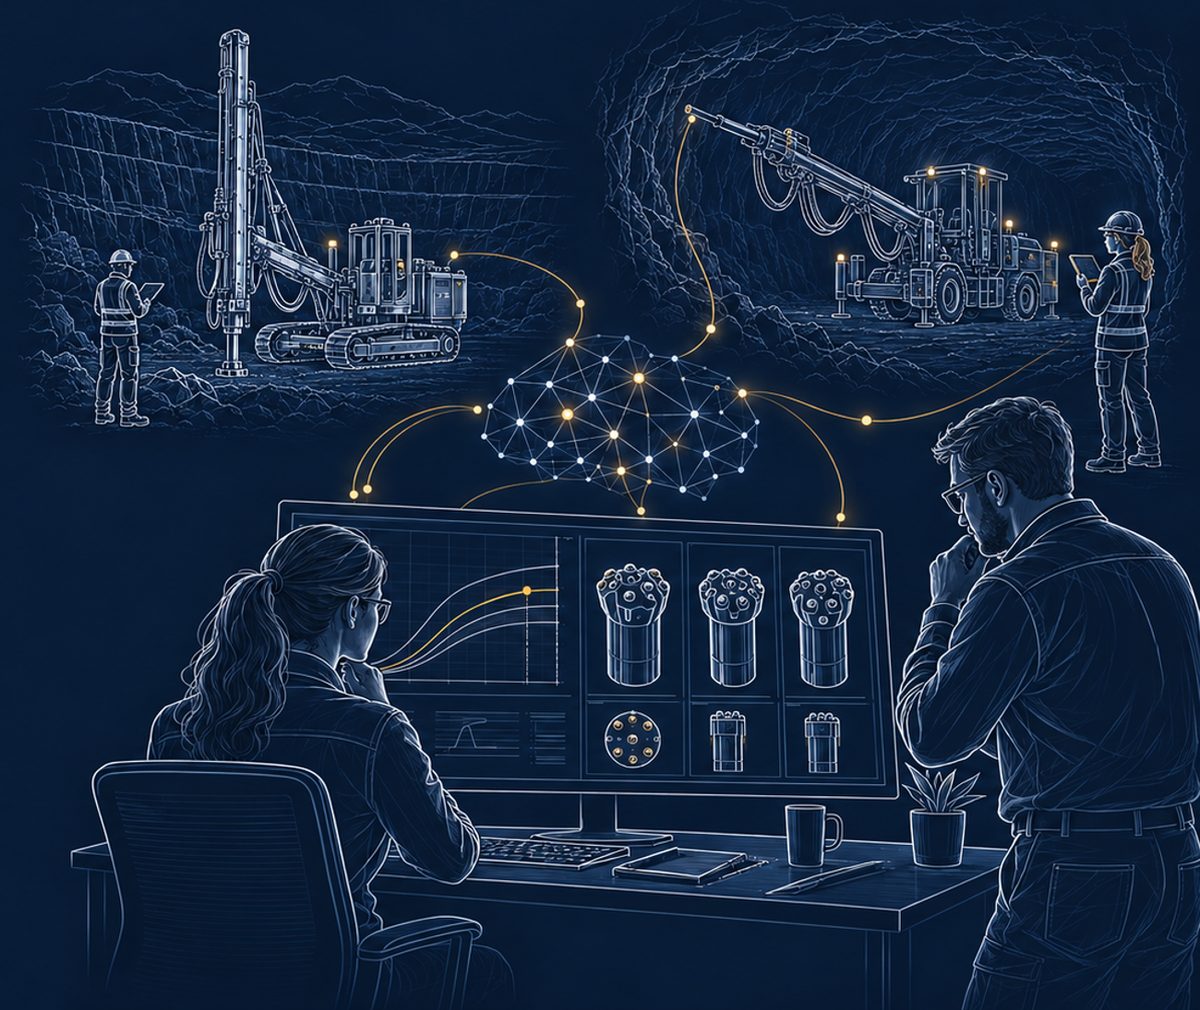
The problem
A drilling tool is only as good as the ground it was tested in, and how it was operated.
Drilling is a complex operation, and the tool that wins in one heading can lose a few hundred metres away. Tool selection sets your cost per metre for years — but a field test only settles it if the conditions behind the numbers are known.
What moves performance
- Ground conditions and rock type
- Tool specification
- Drill rig and rock drill
- Driller skill
- Applied drilling parameters
All of it moves the result at once. So a test is only conclusive when every one of those is captured alongside the metres drilled — and when the comparison that follows is like-for-like, normalised for the ground each tool actually met.
PLAN
Without a defined test plan and clear instructions for technicians and drillers, two tests of the same tool aren't measuring the same thing.
CAPTURE
Recording by hand is slow and error-prone, and whatever isn't written down on the day can't be recovered afterwards.
COMPARE
Without the conditions each tool actually ran in, a comparison rewards the bit that met the easier ground — not the better tool.
SHARE
The result stays in a file with the person who ran it, out of reach of the people making the purchasing decision.
Each of those is survivable on its own. Together they mean the comparison that justified a purchasing decision can't be reconstructed six months later — and the next decision starts from scratch.
That compounds. Every metre drilled consumes rig time, steel and energy, and across millions of metres the gap between a tool that suits the ground and one that doesn't is measured in material consumed, energy burned and emissions produced that a better-matched tool would have avoided.
How it works
From test design to a finished report.
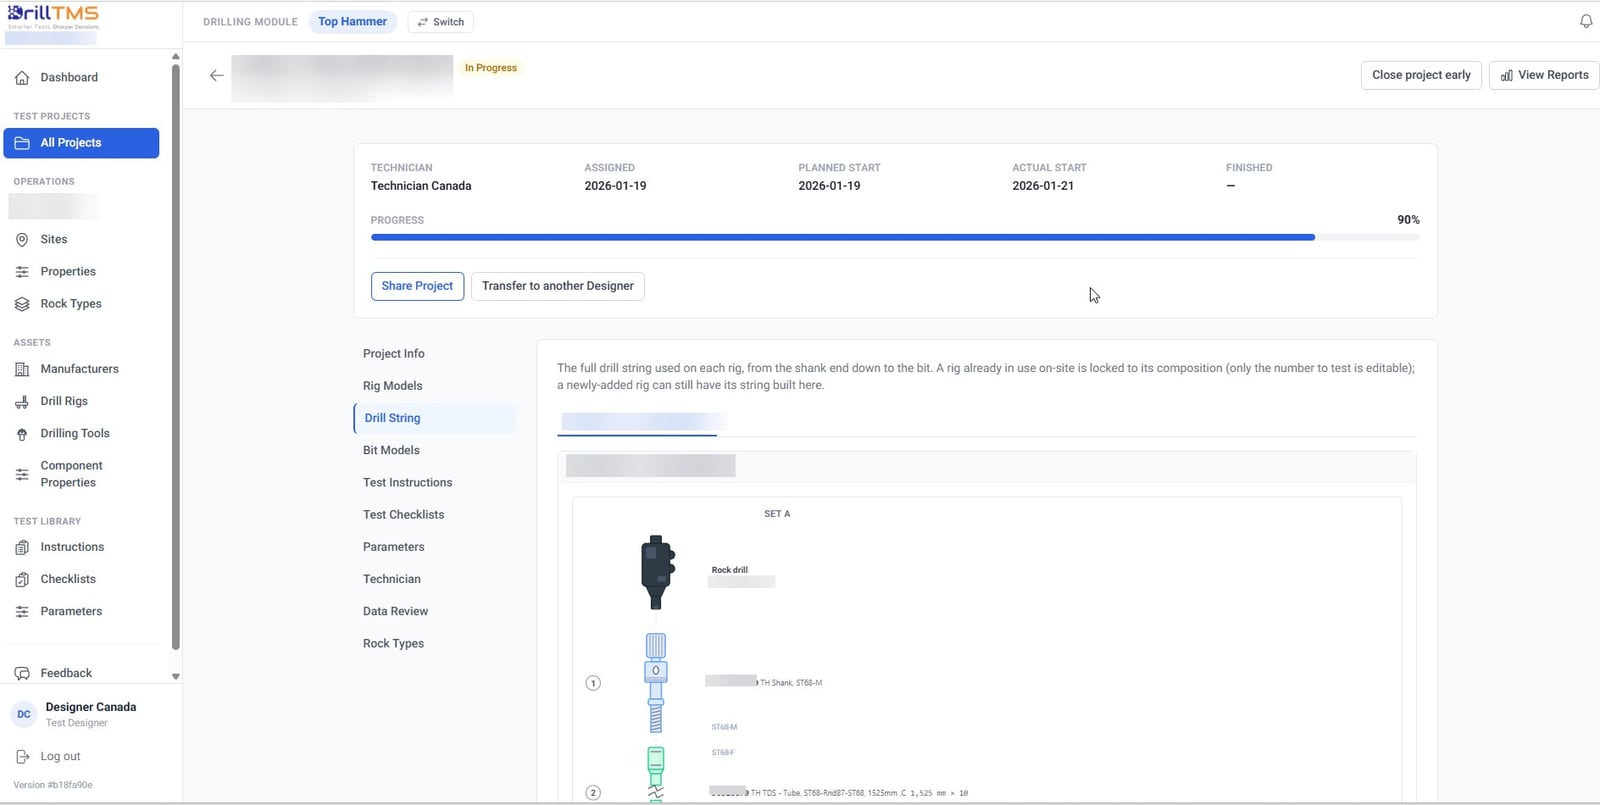
Design the test
Set the drill string, the rig and rock drill, the rock types and the drill locations before anyone goes near a rig — along with the instructions, checklists and parameters the crew will work to. Every test of every tool then measures the same thing.
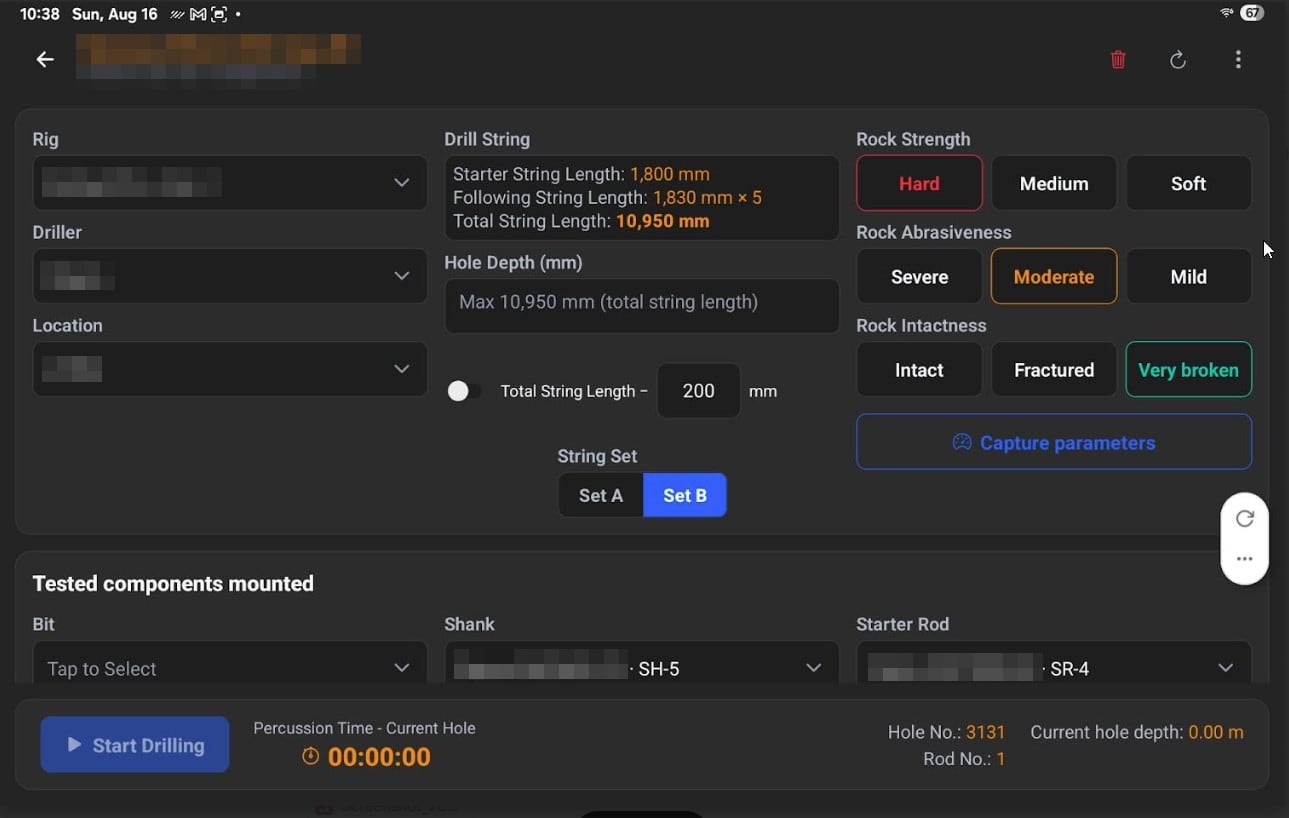
Run it in the field
The technician records the hole on a tablet that works at mine sites with no signal: rig, driller and location, the string set under test, and the ground actually met — strength, abrasiveness and intactness — captured at the face rather than remembered later.
Get the report
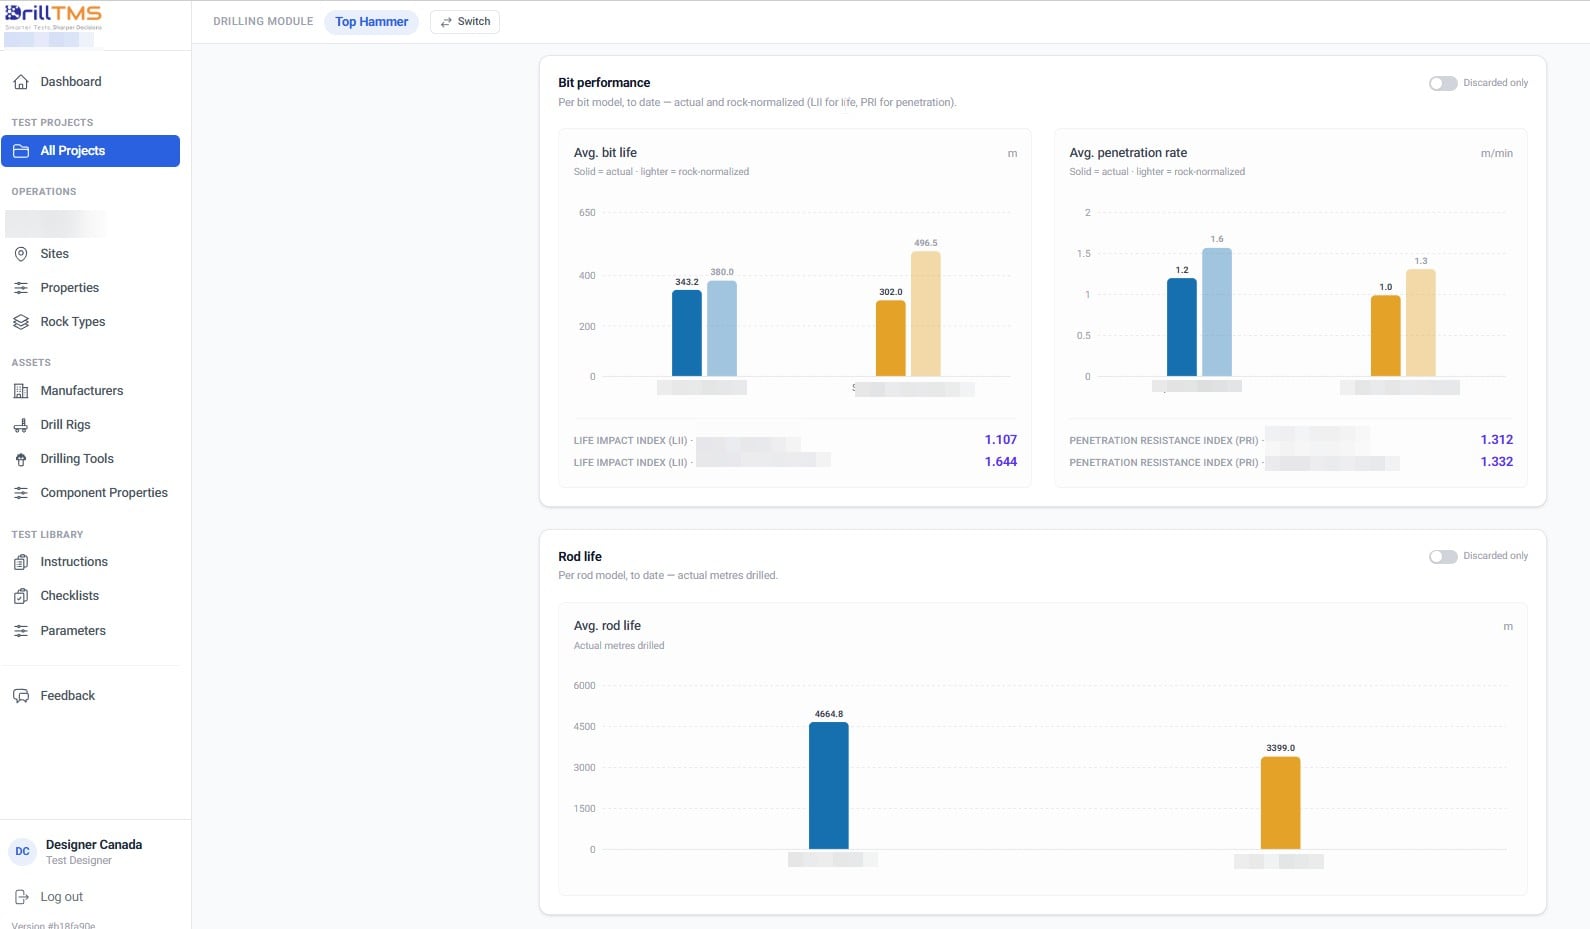
Bit life and penetration rate per model, shown both as measured and rock-normalised — so a tool that met harder ground isn't penalised for it. That is the like-for-like comparison, and it comes out of the data the crew captured, not a spreadsheet rebuilt afterwards.
What you get
Three reports, not a folder of spreadsheets.
The test produces its own record as it runs — while it's running, not weeks after it finished.
COMPONENT SUMMARY REPORT
Life and penetration rate for each individual component under test, average KPI charts per model, and performance broken down by drill location.
DAILY REPORTS
Progress submitted from the field each day, with the technician's tool photos and notes. The tablet syncs whenever it finds a connection, so you're not waiting until the test ends to see how it's going.
FINAL TEST REPORT
One multi-page report pulling the whole test together: the technician's notes and photographs, the charts and graphs, and an AI-drafted executive summary and conclusions.
All three are shared inside the platform — with colleagues, with your other sites, and across your group to a parent company, its subsidiaries and sister companies. Nobody re-keys anything, and the people making the purchasing decision read the same record as the people who ran the test.
Plans
Plans to match how your company works.
Built for mining companies and drilling contractors — the people who own the tools, the site and the operation. None of these are open yet. Join the waiting list and we'll tell you the moment they are.
Standard
For a single company running its own tests.
Enterprise
For a group of companies — a parent and its subsidiaries.
Contributor
Everything in Standard or Enterprise at no charge. A de-identified copy of your test data, under licence, helps build knowledge for the rock drilling industry.
Brand neutrality
We don't advertise manufacturer brands. Any benchmark we publish is based on product attributes and features — never a brand name, never a part number.
Join the waiting list
Talk to us.
Tell us about your operation and we'll get back to you — every path on this site leads to a conversation, not a checkout.